Plotting with errorbars is very simple in python. You just need to replace the plt.plot command with plt.errorbar. This function has the same functionality as plt.plot, except for slightly different syntax. When xerr and yerr arguments are included, errorbars automatically accompany the data points.
An example with no errorbars:


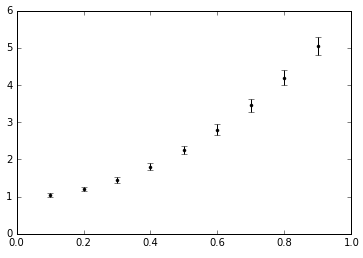
An example with vertical errorbars with uncertainty of 5% in the y data:

An example with randomly generated x and y errorbars:


No comments:
Post a Comment